How we monitor our Oracle APEX servers with AI
· 9 min read
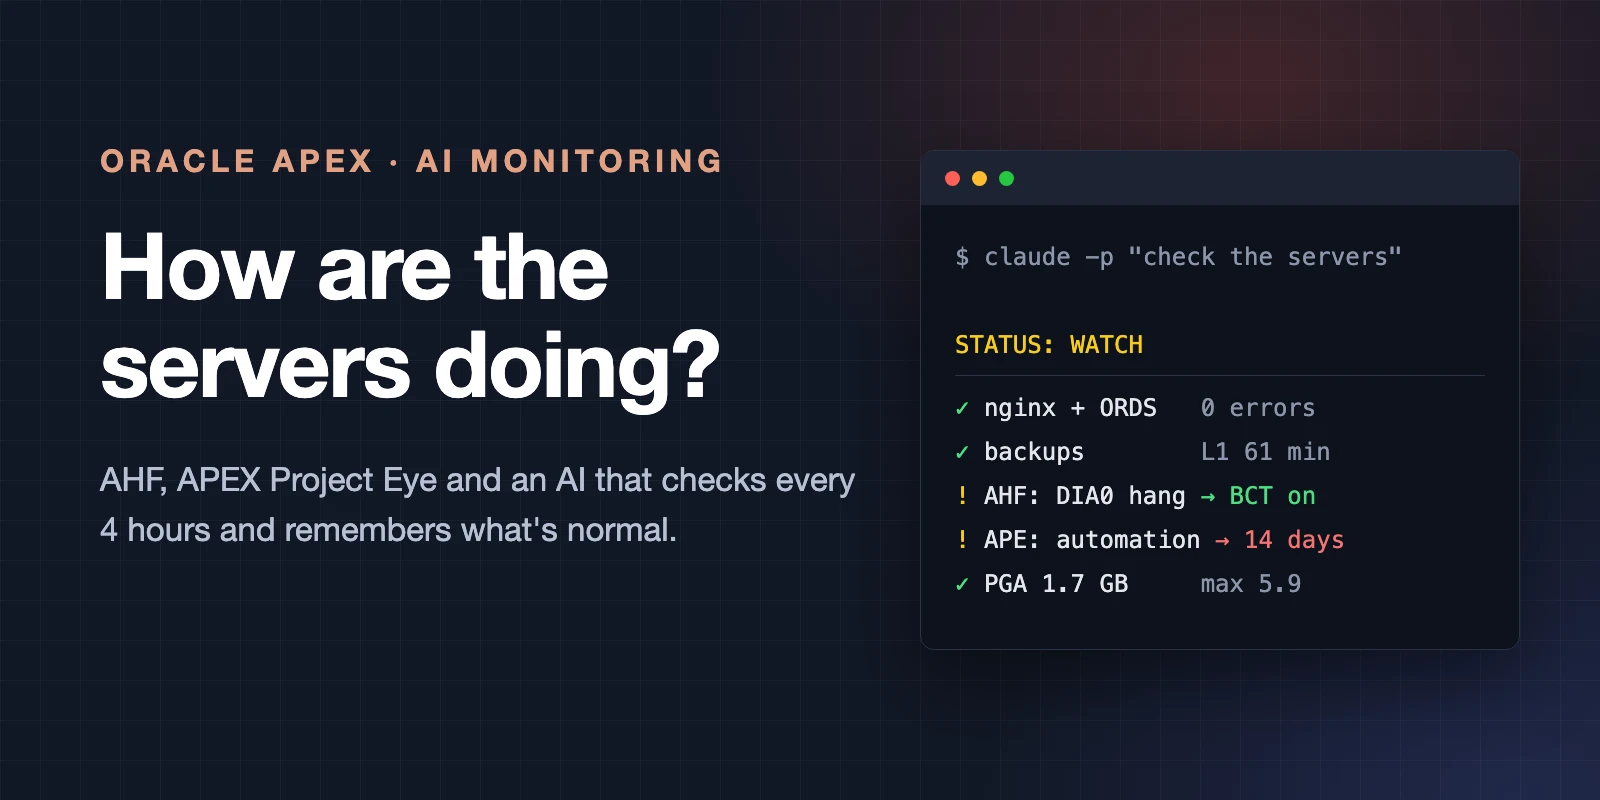
“How are the servers doing?”
For several weeks, that’s what I typed every morning in Claude Code. A few minutes later I knew if our database, ORDS and Nginx were fine, and if not, why. Today I don’t type it anymore: the check runs on its own, and I only hear from it when there is something to look at.
In my last post I wrote about AHF, Oracle’s health check for the database server. This post is about the rest: how we watch the whole stack, and what AI changed there. We know Oracle well at United Codes, but nobody here is a full-time sysadmin watching servers all day. I think that’s the case for a lot of you running your own environment, so I hope our learnings help. They’re our learnings, not a best-practice guide.
What we run
For many environments we use Oracle Autonomous AI Database, where Oracle does the monitoring, patching and backups for us. But we also run our own servers, for development, to control which versions we run, and to test things for customers on the same setup they have. That’s where we have to do the monitoring ourselves.
That setup is pretty standard for Oracle APEX: Nginx in front, two ORDS instances behind it, and a database server with our Oracle AI Database 26ai CDB and an older 19c one. Every page request goes Nginx → ORDS → database. So when a customer says “the app is slow”, the problem can be in any of the three. That’s why checking only the database is not enough.
What the AI checks
I didn’t build a monitoring product. I gave the AI SSH access to the servers and a description of how they’re set up, and asked it to check what I would check if I had the time: are the services up, errors in the logs of Nginx, ORDS and the database, memory, disk space, backups, failed jobs, and what AHF and APEX Project Eye found (more on both below).
Give it a map of your servers
This is the most important learning. The AI is only as good as what it knows about your setup.
So we keep notes it reads every time: which server does what, where the logs are, how to run SQL, which ports ORDS runs on. And small things like “both servers log in UTC, I talk in Belgian time”. That one sounds silly, but it saved us a lot of confusion: when I say “the app was slow at 3 o’clock”, it first converts the time and then looks at Nginx, ORDS and the alert log for the same window.
After every check it also writes down what it saw: the numbers, what changed, what to watch. So the next check doesn’t just say “all OK”, it says “this disk went from 82% to 88% in a few days, at this rate it’s full in two weeks”. A trend is worth more than a status.
What a check looks like
This is a real answer (a bit shorter):
Web server (Nginx + ORDS): OK. Up 5 days. Both ORDS instances respond. No 5xx in the last hour, no ORDS errors today.
Database server: OK. Last night’s backup finished in 58 minutes. The ORA-04036 session kills seem to have stopped: 53 on the day we moved PRD, none since.
Things to watch:
- One disk is 88% full, it was 82% a few days ago.
- A scheduler job fails every night in DEV: it doesn’t compile, a column was changed.
That’s what I want: what’s fine, what’s not, and what to do about it. In a minute of reading.
AHF finds it, the AI explains it
This morning showed best how it all fits together.
Claude did its morning check: all healthy. Then I saw an email from AHF, sent at 02:58:
DIA0 Critical Database Process As Root: Hang ID 1 blocks 1 sessionsSo TFA saw a hang in our 19c CDB, and Claude didn’t. It searched the alert log for ORA- lines, and this message has no ORA- in it. AHF watches patterns I (and the AI) didn’t think of.
I pasted the email in Claude Code. A few minutes later I had the full story: at 02:30 the nightly RMAN level 1 backup of our 26ai CDB starts. Block change tracking was disabled, so every “incremental” backup still reads all datafiles, for an hour, every night. Part of the 19c datafiles are on the same disk, so its database writer couldn’t get its writes through. The Hang Manager trace showed “IO load is abnormally high” every night since we scheduled those backups. Last night was just the first time it was bad enough to be called a hang.
The fix is one command:
alter database enable block change tracking using file '/u03/oradata/CDB2/bct_cdb2.chg';I ran it, Claude verified it, and wrote in its notes to check the first backup after Sunday’s level 0: does it use the change tracking file, and is the IO warning gone at night.
That’s the combo I like: AHF finds it, the AI explains it, proposes a fix and keeps watching it.
APEX Project Eye watches the apps
AHF looks at the database. But a server can be perfectly healthy while an app is not.
For the apps we use APEX Project Eye (APE). I’m biased as we built it at United Codes. We started it to see the activity in our own Oracle APEX instance, and it grew from there. Today it also gives insights into the APEX apps themselves, can generate documentation for them, and runs quality assurance checks while you develop. Just like dbLinter does for the database and PL/SQL, APE does it for Oracle APEX apps. And in the next major release we’re adding an SLA module.
The part I use for monitoring is the Watchtower. It runs a scanner every day with sensors like long running pages, new kinds of errors, failed automations and failing web service calls, and it sends a summary.
When I looked at that summary with fresh eyes, I saw a problem: it said “Action required” every day, for mostly the same things. And when something says “Action required” every day, you stop reading it. That’s not APE’s fault, that’s human.
So I asked Claude to read APE too, straight from its tables, like any other log. The first time, it found an automation in one of our apps with 100% error rows, every day for weeks. And web service calls to an AI server we don’t run anymore: APE showed it as one line, but it was almost 16,000 failed calls since mid-October.
Then it found something worse than noise: sensors that said “Normal” while they couldn’t see the problem. One sensor only saw the jobs of APE’s own schema, so it said “Normal” every day while a job in another schema failed on every run. A sensor that’s blind is worse than no sensor, because you trust it.
So we fixed those and added six new sensors. Claude tested them in DEV first, including the rollback, and wrote it up as a script for our APE dev team, so the fixes can go into APE itself. On the first run, a new sensor found an automation that got an HTTP 500 from an accounting API about 240 times a day.
AHF watches the database, APE watches the apps, the AI reads both and remembers.
What it found
Some other real things from the last weeks:
- A 5 minute outage. The database server was swapping: HugePages weren’t configured, so Linux could swap out part of the SGA.
- A bot doing about 490,000 requests a day on one of our apps. We had a rule for it in Nginx, but for the wrong URL pattern.
- A memory leak that killed sessions with ORA-04036 about 5 times a day. The AI went through 65 incident traces and found the same PL/SQL JSON heap in all of them. More in the upgrade post.
- A payment bug. Since 2020, one Stripe checkout fired two webhooks and our code handled both. No double invoices, but our payment reports counted those twice.
- Jobs that never worked, like a bank statement import that failed on every run for a month, while people uploaded the files by hand.
None of these was an alarm going off. A job that fails every day becomes “normal”. They were all found by someone (something?) reading the logs with attention, every day, and asking why. That’s the part I never had time for.
Claude and Grok
We use two AIs, and they do different things.
Grok got a short prompt with the servers, where the logs and configs are, and the question to check them and see what we can optimise. It started from zero every time, and the prompt still said 19c after we moved to 26ai. Funny detail: Claude noticed a 403 in the ORDS logs every 4 hours, and traced it back to Grok’s own health check. One AI found the noise of the other one.
Claude (Claude Code) is the one with the memory. It keeps the notes from every check, so it knows what’s normal for us, what we changed last week, what it promised to look at again. That’s why the deep dives are all Claude. It’s also the one I trust to propose a fix, because it knows the history of that server.
If I could only keep one, I’d keep the one with the memory.
Rules I follow
This is where I’d be careful if you start with it:
- Read-only by default. Changing something on production, I want to see the command first.
- Ask for a backup and a way back. Every change we made had a backup of what it changes and a rollback.
- Ask for numbers, not “it’s fine”. How many errors, since when, compared to yesterday.
- It makes mistakes. It once ran a statistics job that blew up the PGA. It gave me a command that wiped a crontab instead of backing it up (it rebuilt it from an older backup and the logs). And this morning it missed the hang that AHF caught. You stay responsible, not the AI.
- Think about access. It runs with my SSH keys and sudo. That’s a lot of power.
From asking every morning to a schedule
The first weeks I asked every morning and read the answer. On purpose: I wanted to see what it flags, what it misses and how it reasons, before I trust it when it says “all OK”.
Once I did, there was no reason to keep asking by hand. Now Claude Code runs headless (claude -p) every 4 hours from a scheduled job on my Mac. Fixed, read-only scripts collect the data, Claude reads it together with its notes, digs deeper when something is new, and writes one line in its log. Its answer starts with STATUS: OK, WATCH or ACTION, and only for the last two I get a notification. A run takes less than a minute.
I still ask for a check when I want one, for example after a change or when a customer says the app is slow. But I don’t have to remember it anymore.
One more learning: the notes need maintenance too. After a few weeks they were long, full of “check 10-27: healthy”. The useful part is the decisions and the lessons. So the scheduled check keeps a short log and turns the older entries into a trend. A trend, not a diary.
What’s next
When an AHF email comes in, the check should start by itself, instead of me pasting the email. And I want to make “read-only” a real lock instead of a rule in a prompt: a separate SSH user and a read-only database account for the monitoring.
If you manage your own Oracle APEX environment, try it: give an AI read access and a map of your servers, and ask “how are the servers doing?”. You’ll be surprised what it finds 😀
And if you’d like help setting it up for your environment, that’s something we do at United Codes.
Comments
No comments yet. Be the first.