Oracle APEX: the Power of the Activity Logs
The issue
Have you ever had those moments when an end-user calls you out of the blue with a disturbing message about your app?
It happened to me last week; an end-user called in a panic with the message, "all my inspections are gone!"
FYI: This Oracle APEX application manages all inspections a company is doing. Those inspections are grouped into different categories.
My thoughts
Records don't disappear automatically, so my mind immediately started to think about the potential reasons why this might have happened:
Did we update the app with an invalid WHERE clause or a bad JOIN?
Did we have a DELETE process that didn't have a condition?
Did a user do a bulk delete action or delete a parent record that caused the child records to go?
The investigation
On the call, I asked the user to tell me what he saw. It was weird indeed; the categories showed there were zero inspections.
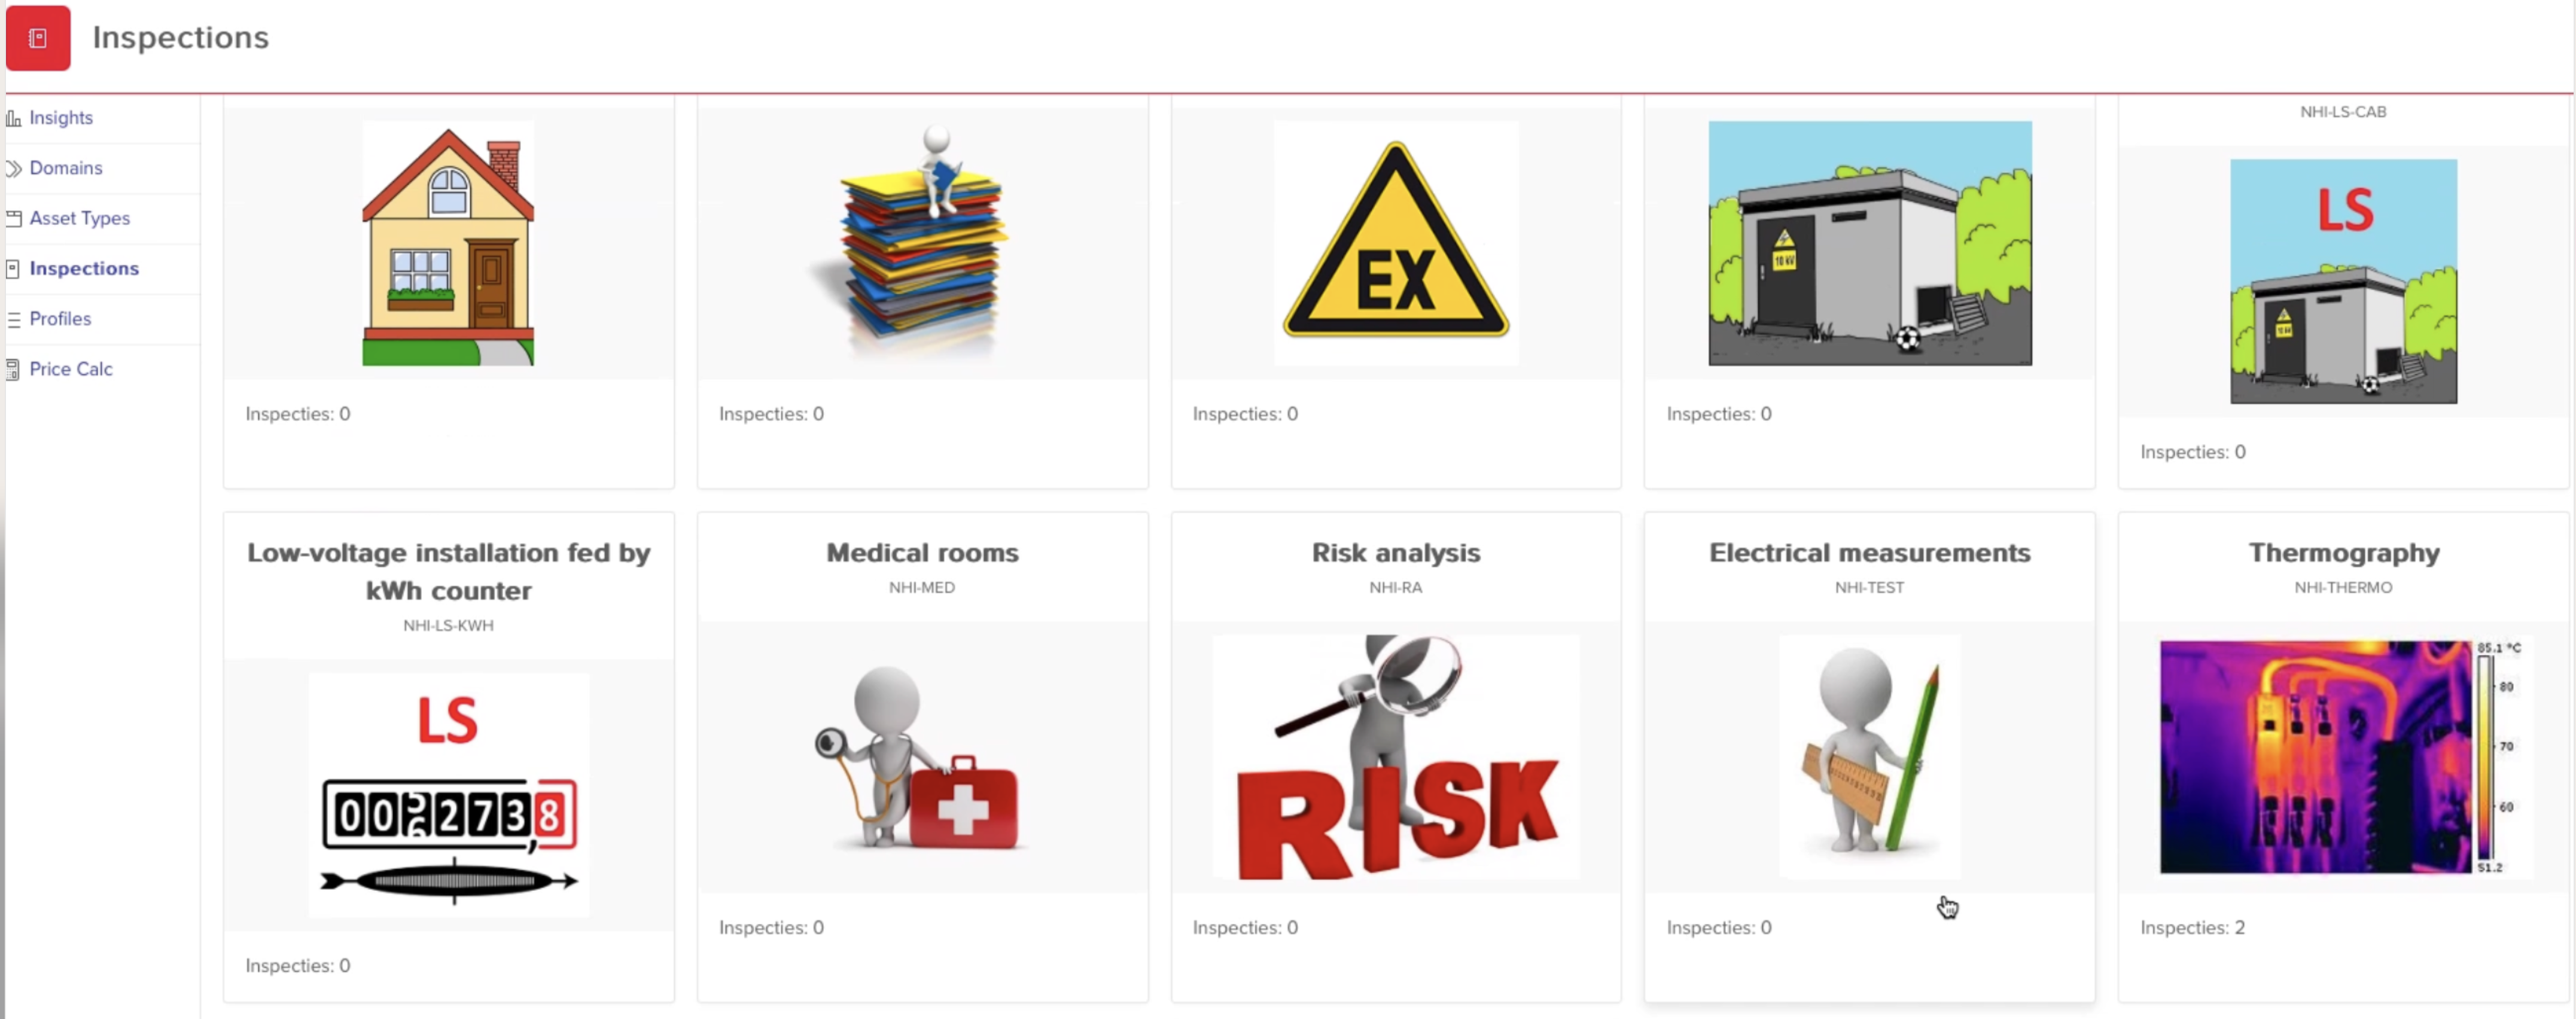
But this one category (Thermography) still had two inspections... bizarre.
I asked a few more questions and got the answers that parents or children were not deleted, bulk actions were not executed, and the records were there in the morning, but were gone in the afternoon.
As we didn't deploy a new version of the app, and it worked before, it was a bit of a mystery to me.
Activity Logs to the rescue
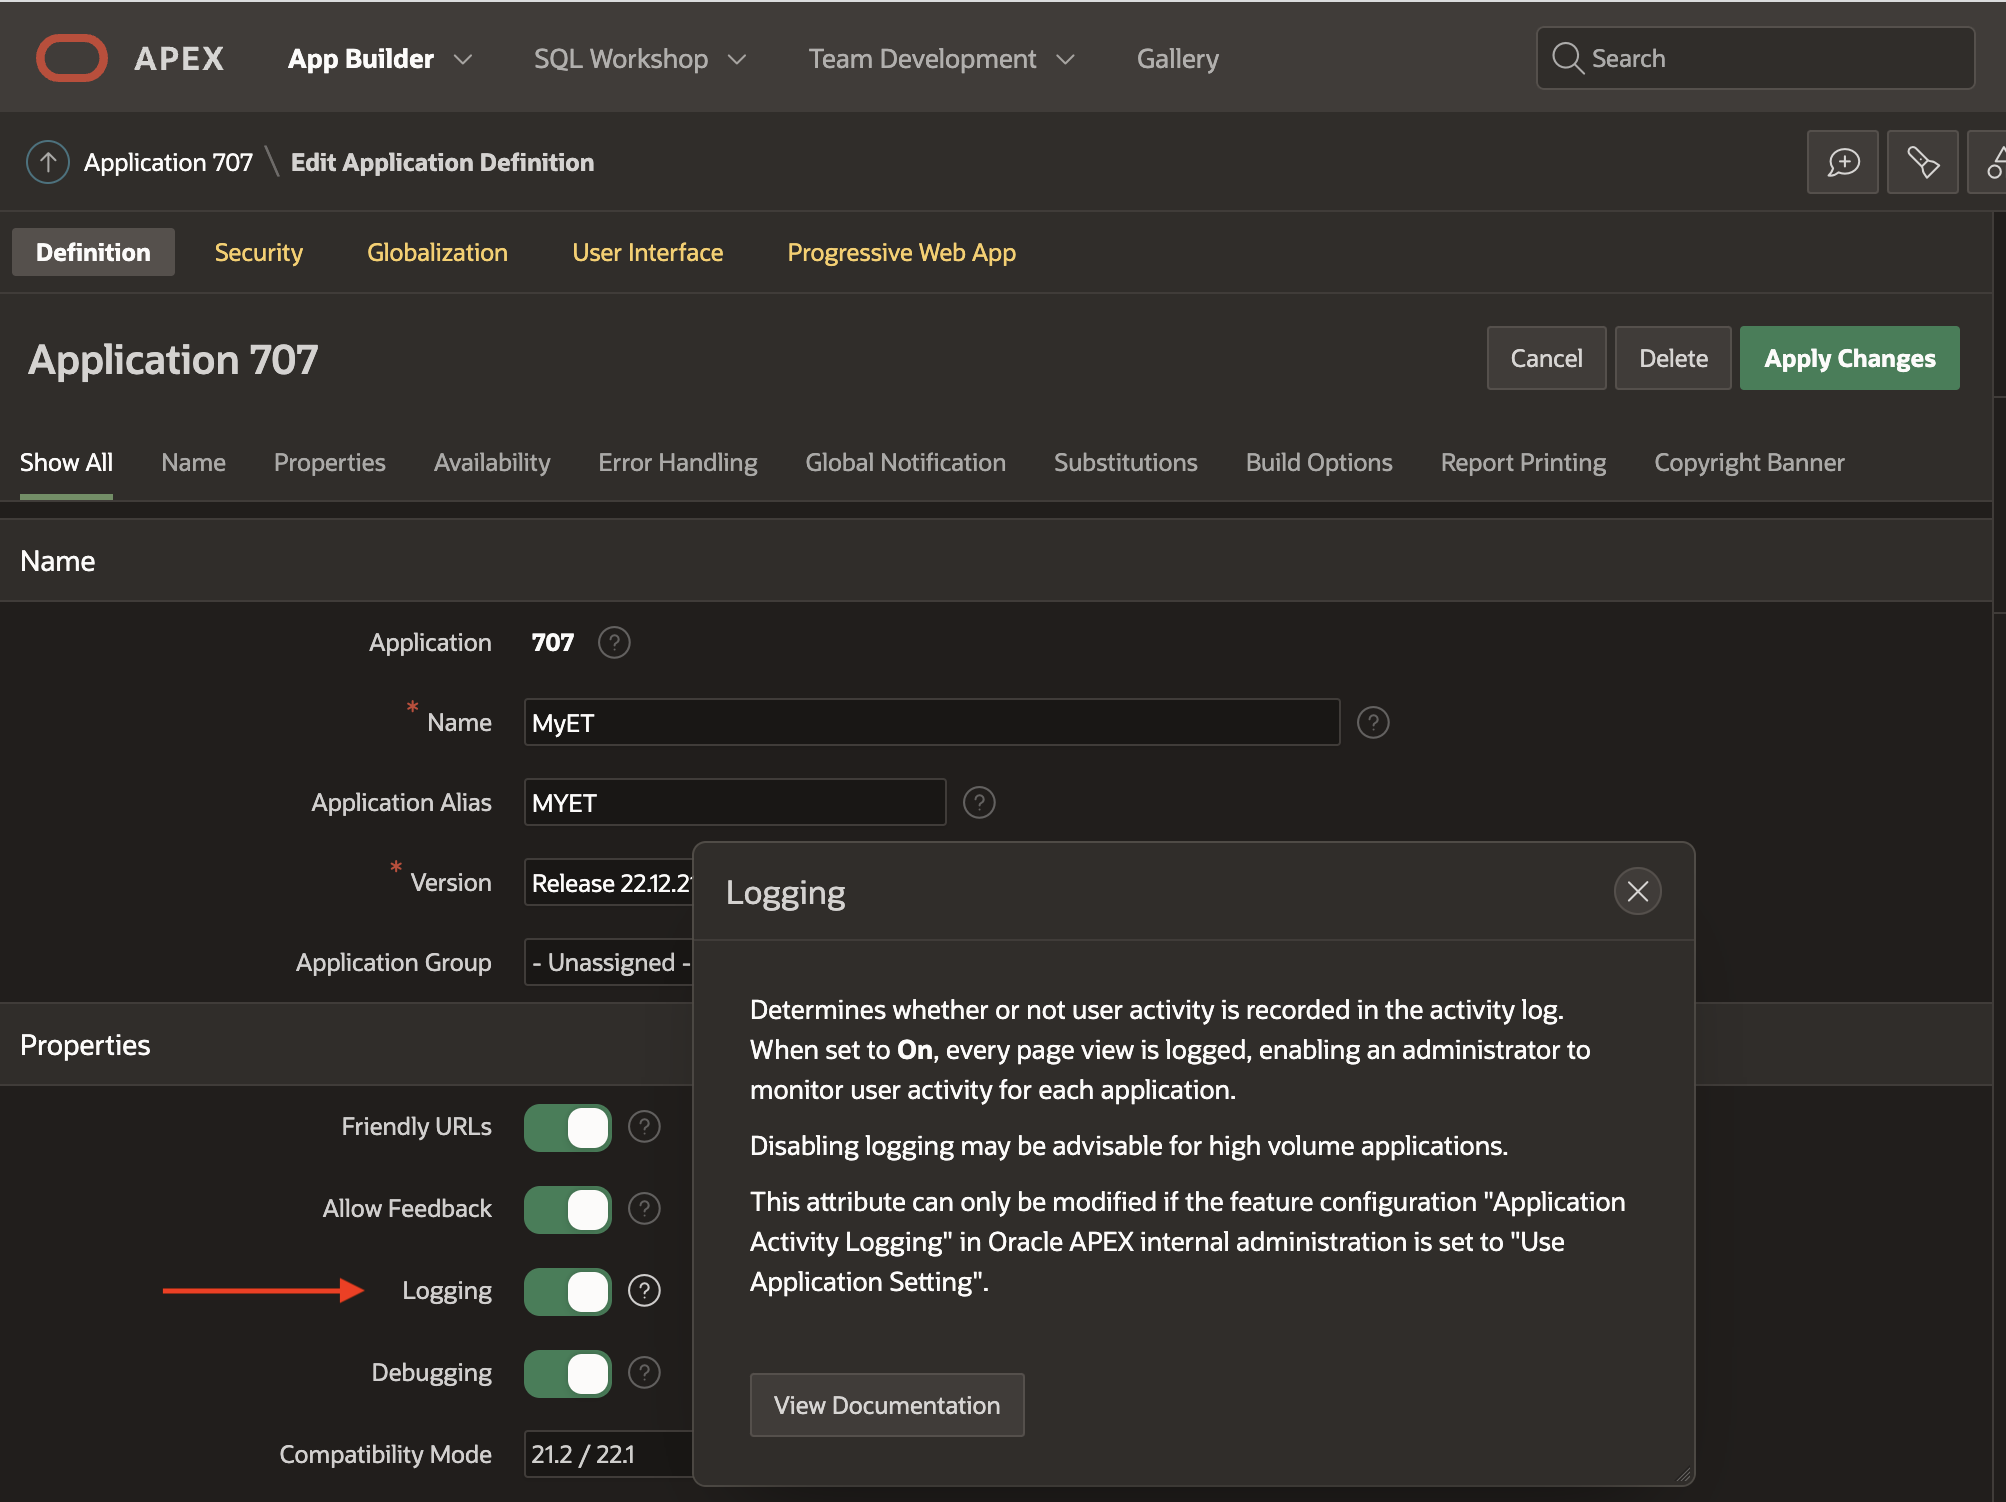
This is when I'm glad Oracle APEX has a built-in feature that logs a user's activity, which is turned on by default. You find the setting in your Application Attributes:
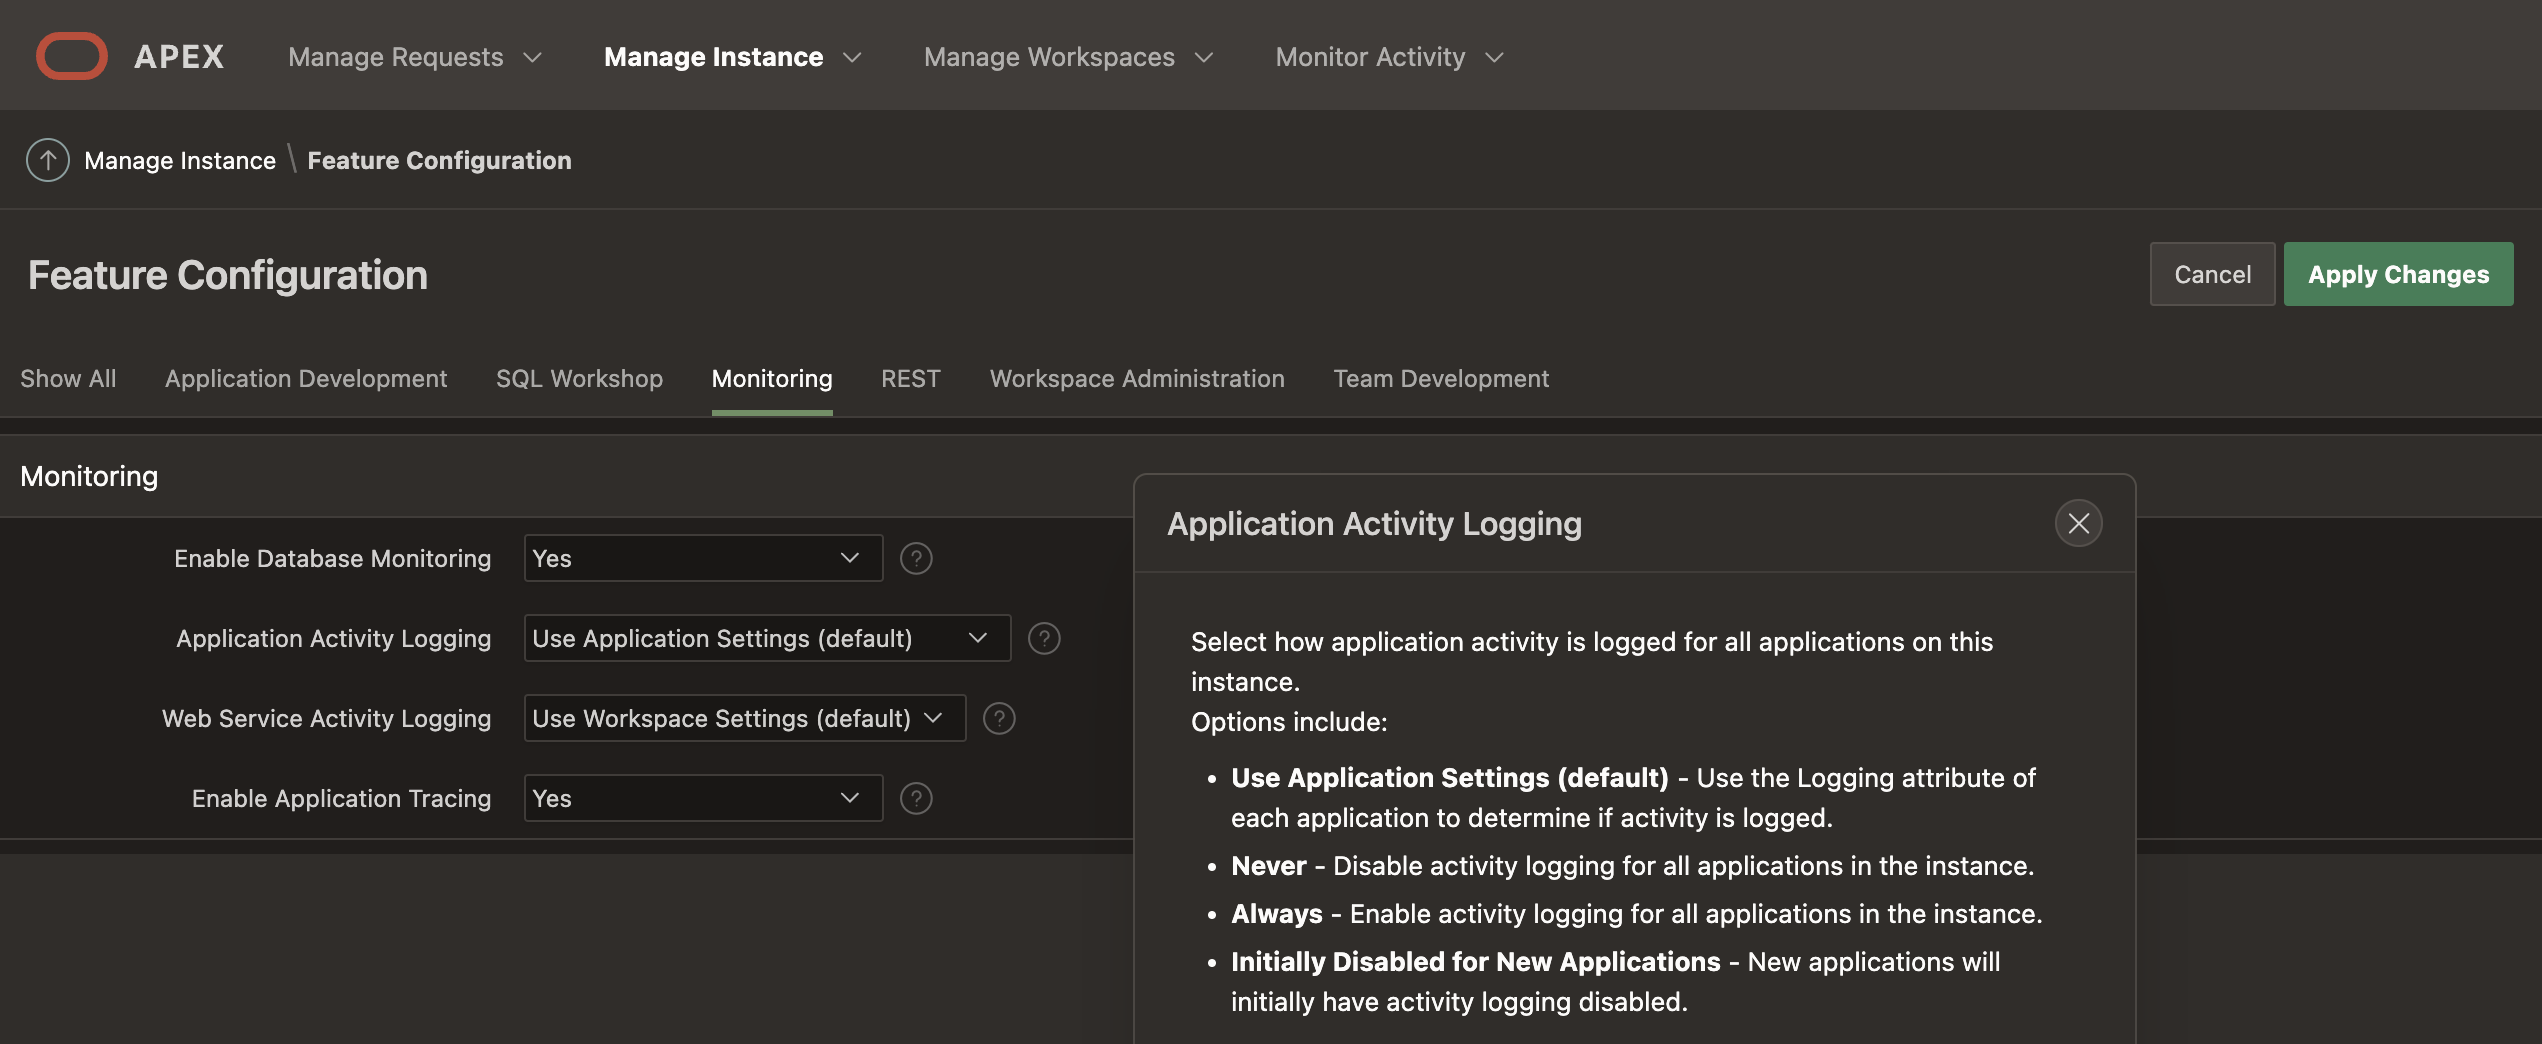
You can change the default settings of an app in the instance settings (INTERNAL workspace) under Manage Instance > Feature Configuration > Monitoring.
By default, at least 14 days of log data will be stored, but it can be changed in the instance settings under Manage Instance > Manage Log Interval.
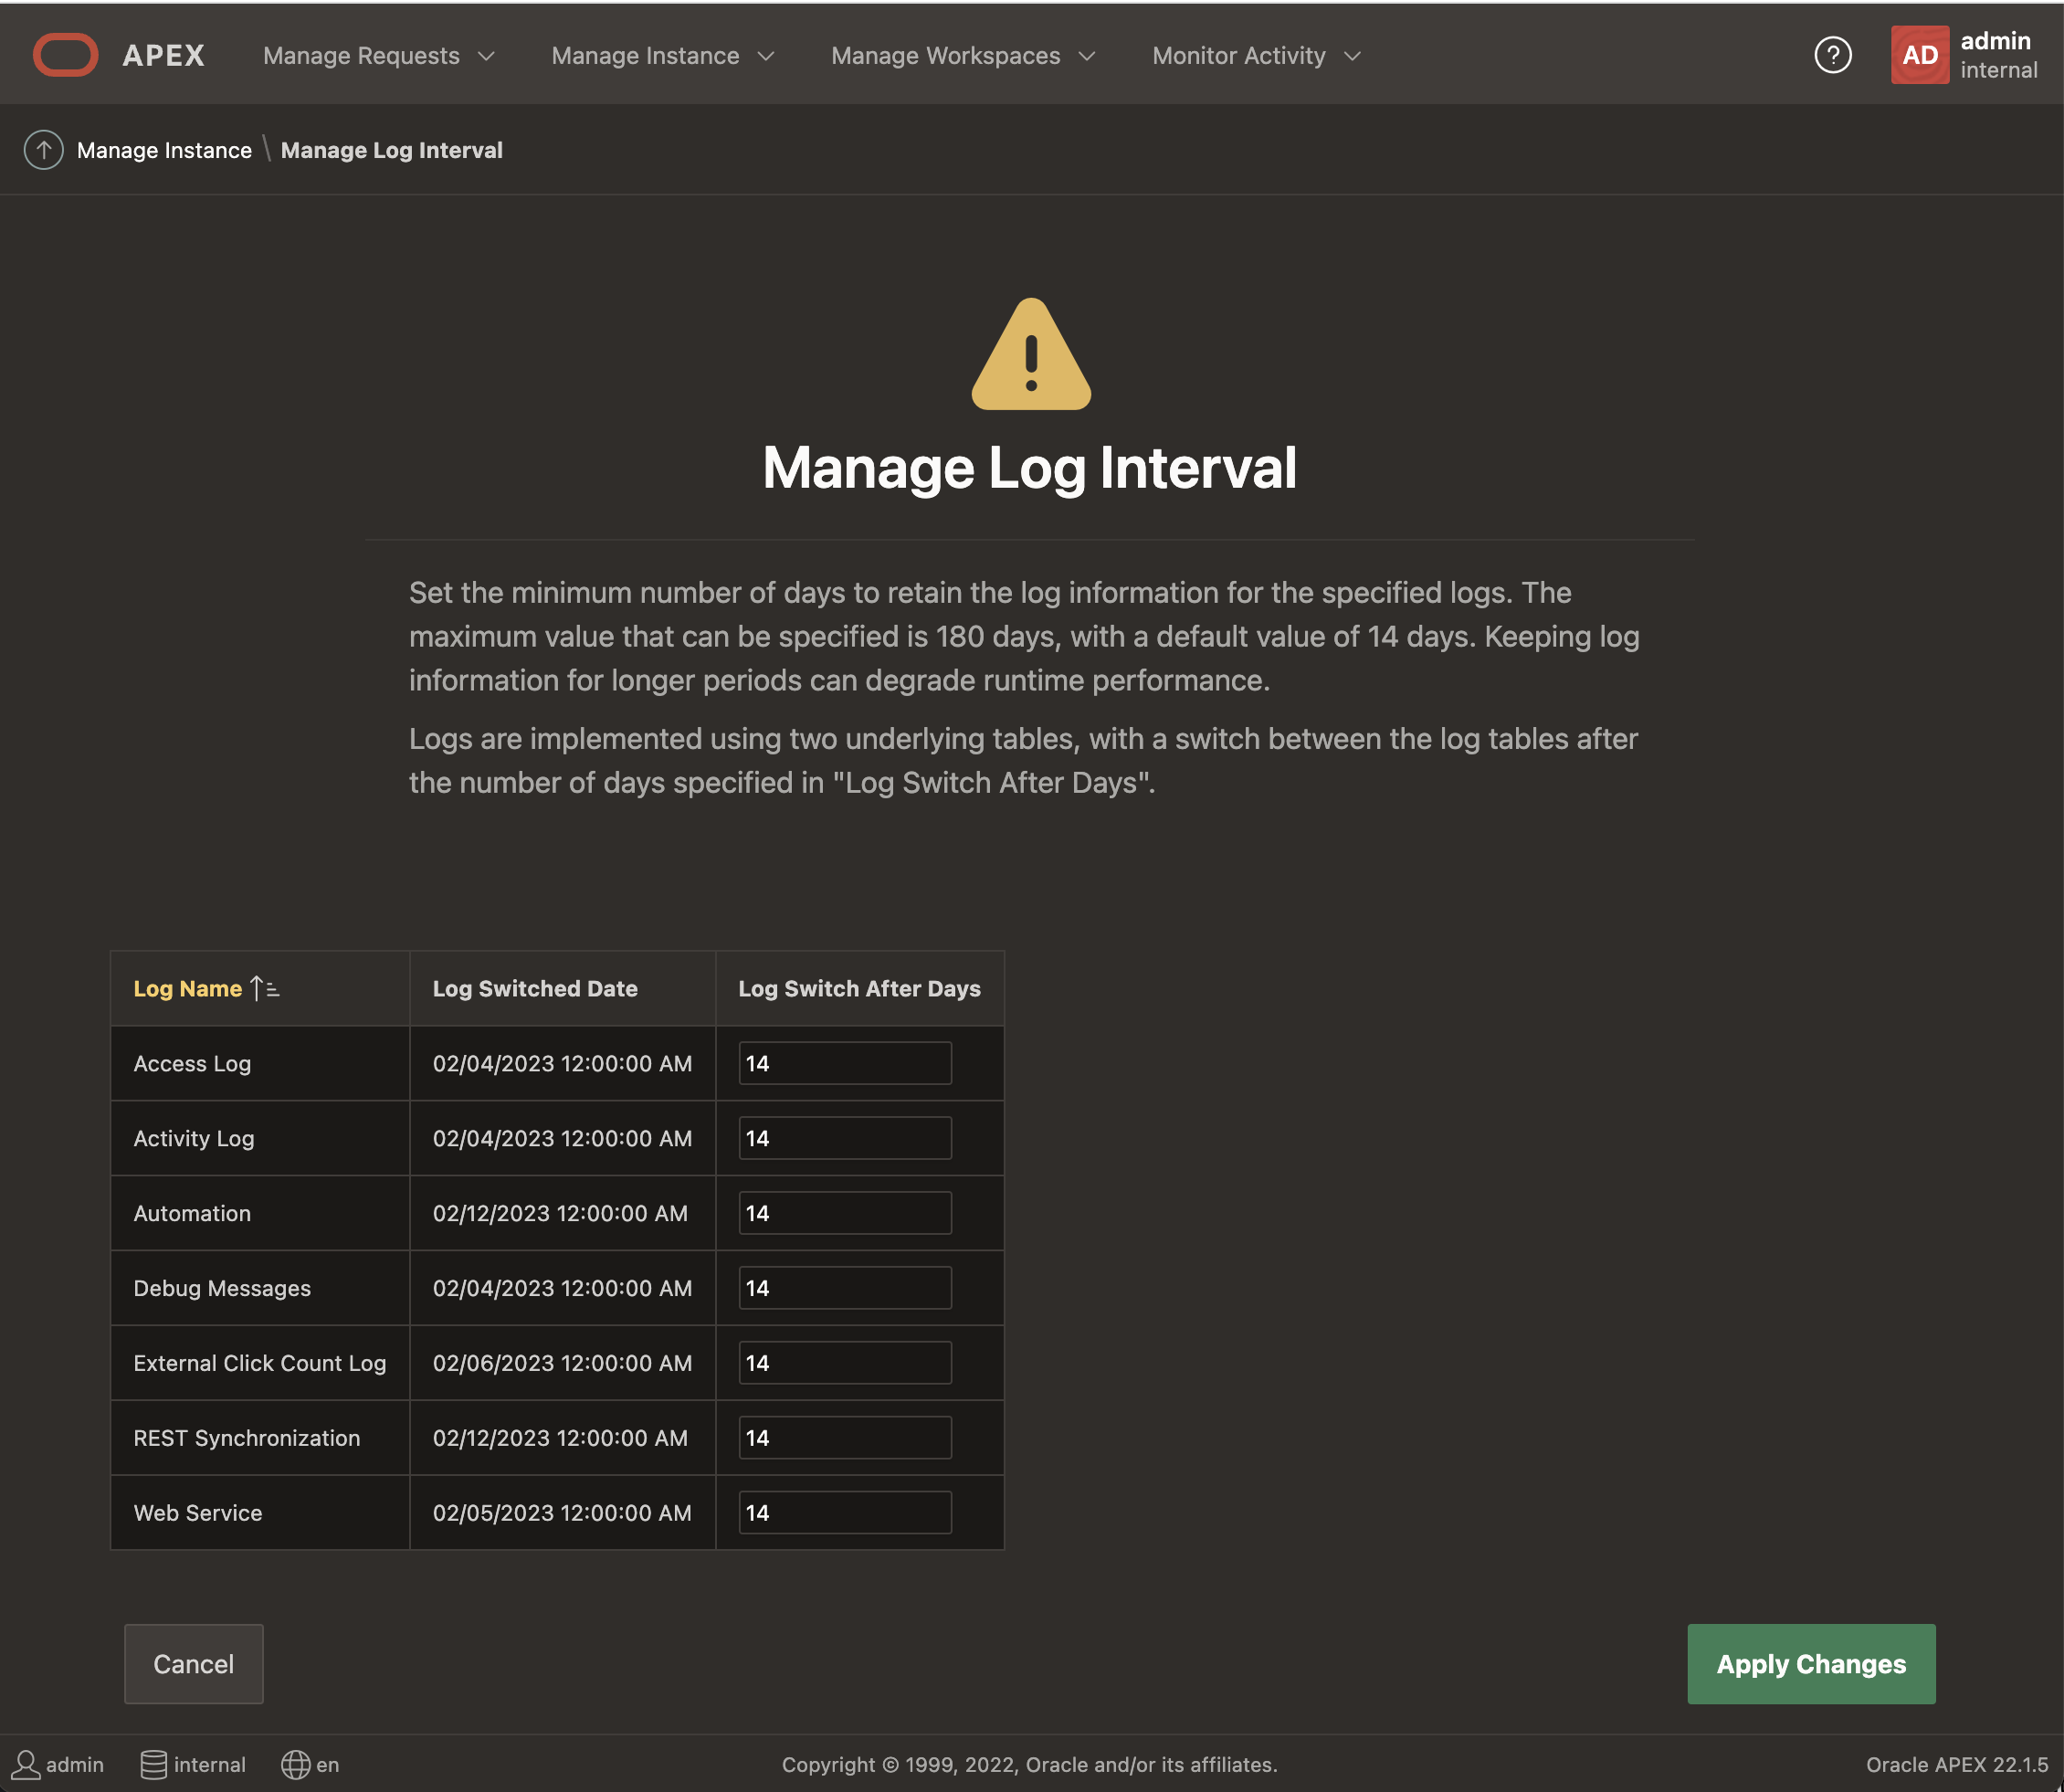
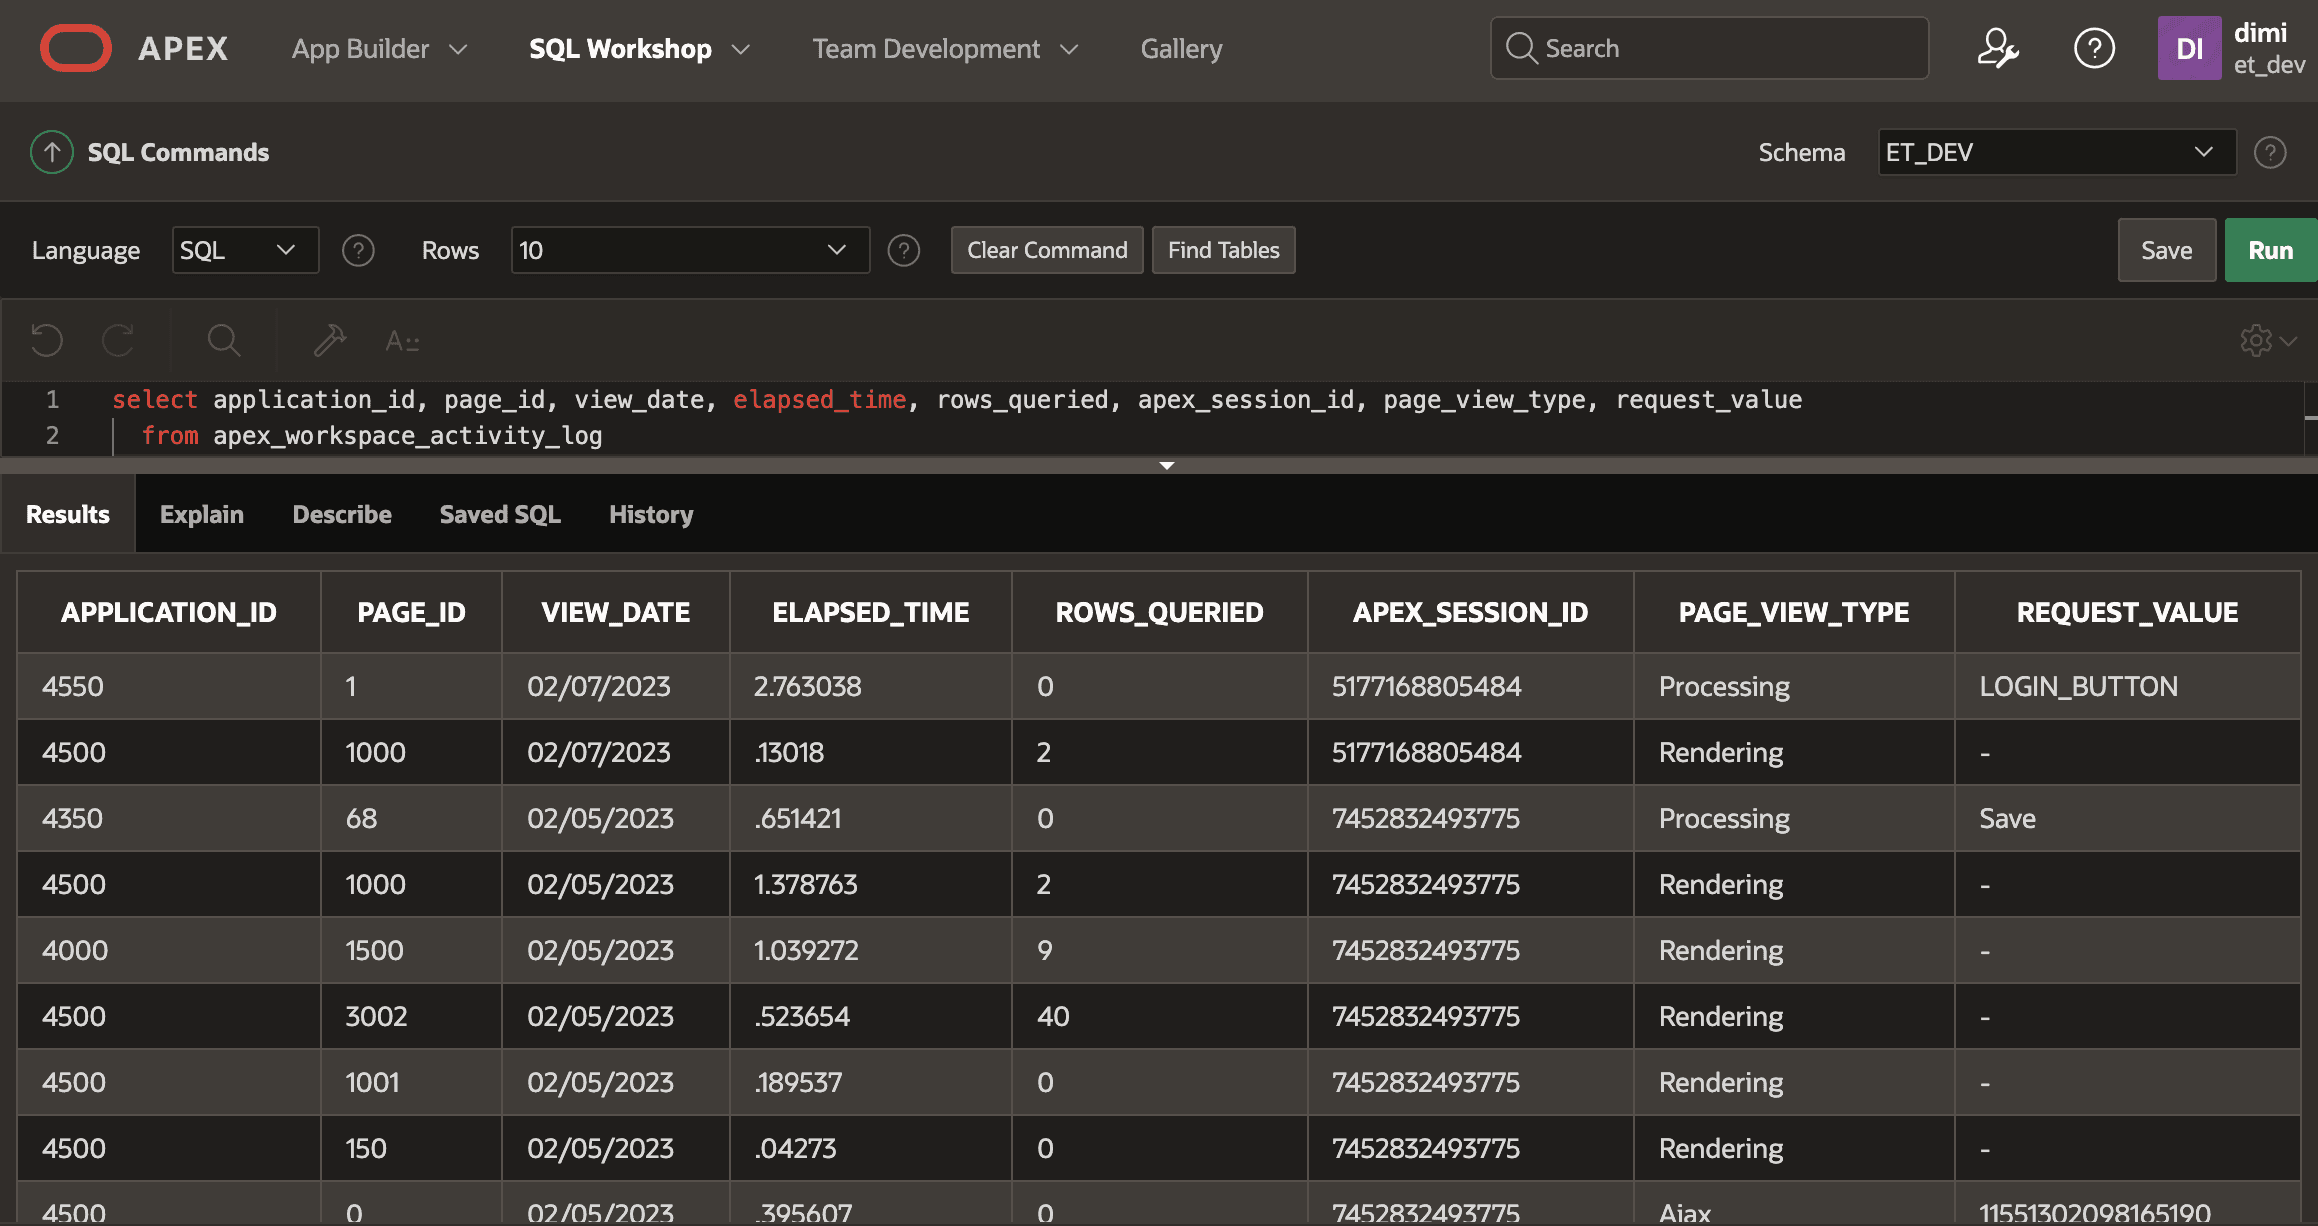
The logs are captured in two different tables: wwv_flow_activity_log1 and wwv_flow_activity_log2. APEX is switching the table used behind the scenes every x days (the setting above). In case you leave the log switch to 14 days, it means that you have 14 to 27 days of activity logs. You don't have to worry about which table to query to see the data. You instead use the view APEX_WORKSPACE_ACTIVITY_LOG.
I wanted to give this background as you may want to increase your logs. The maximum amount before a log switch happens is 180 days. If you need more, you need to copy the records to your tables (also read further on that APEX Project Eye can help with this).
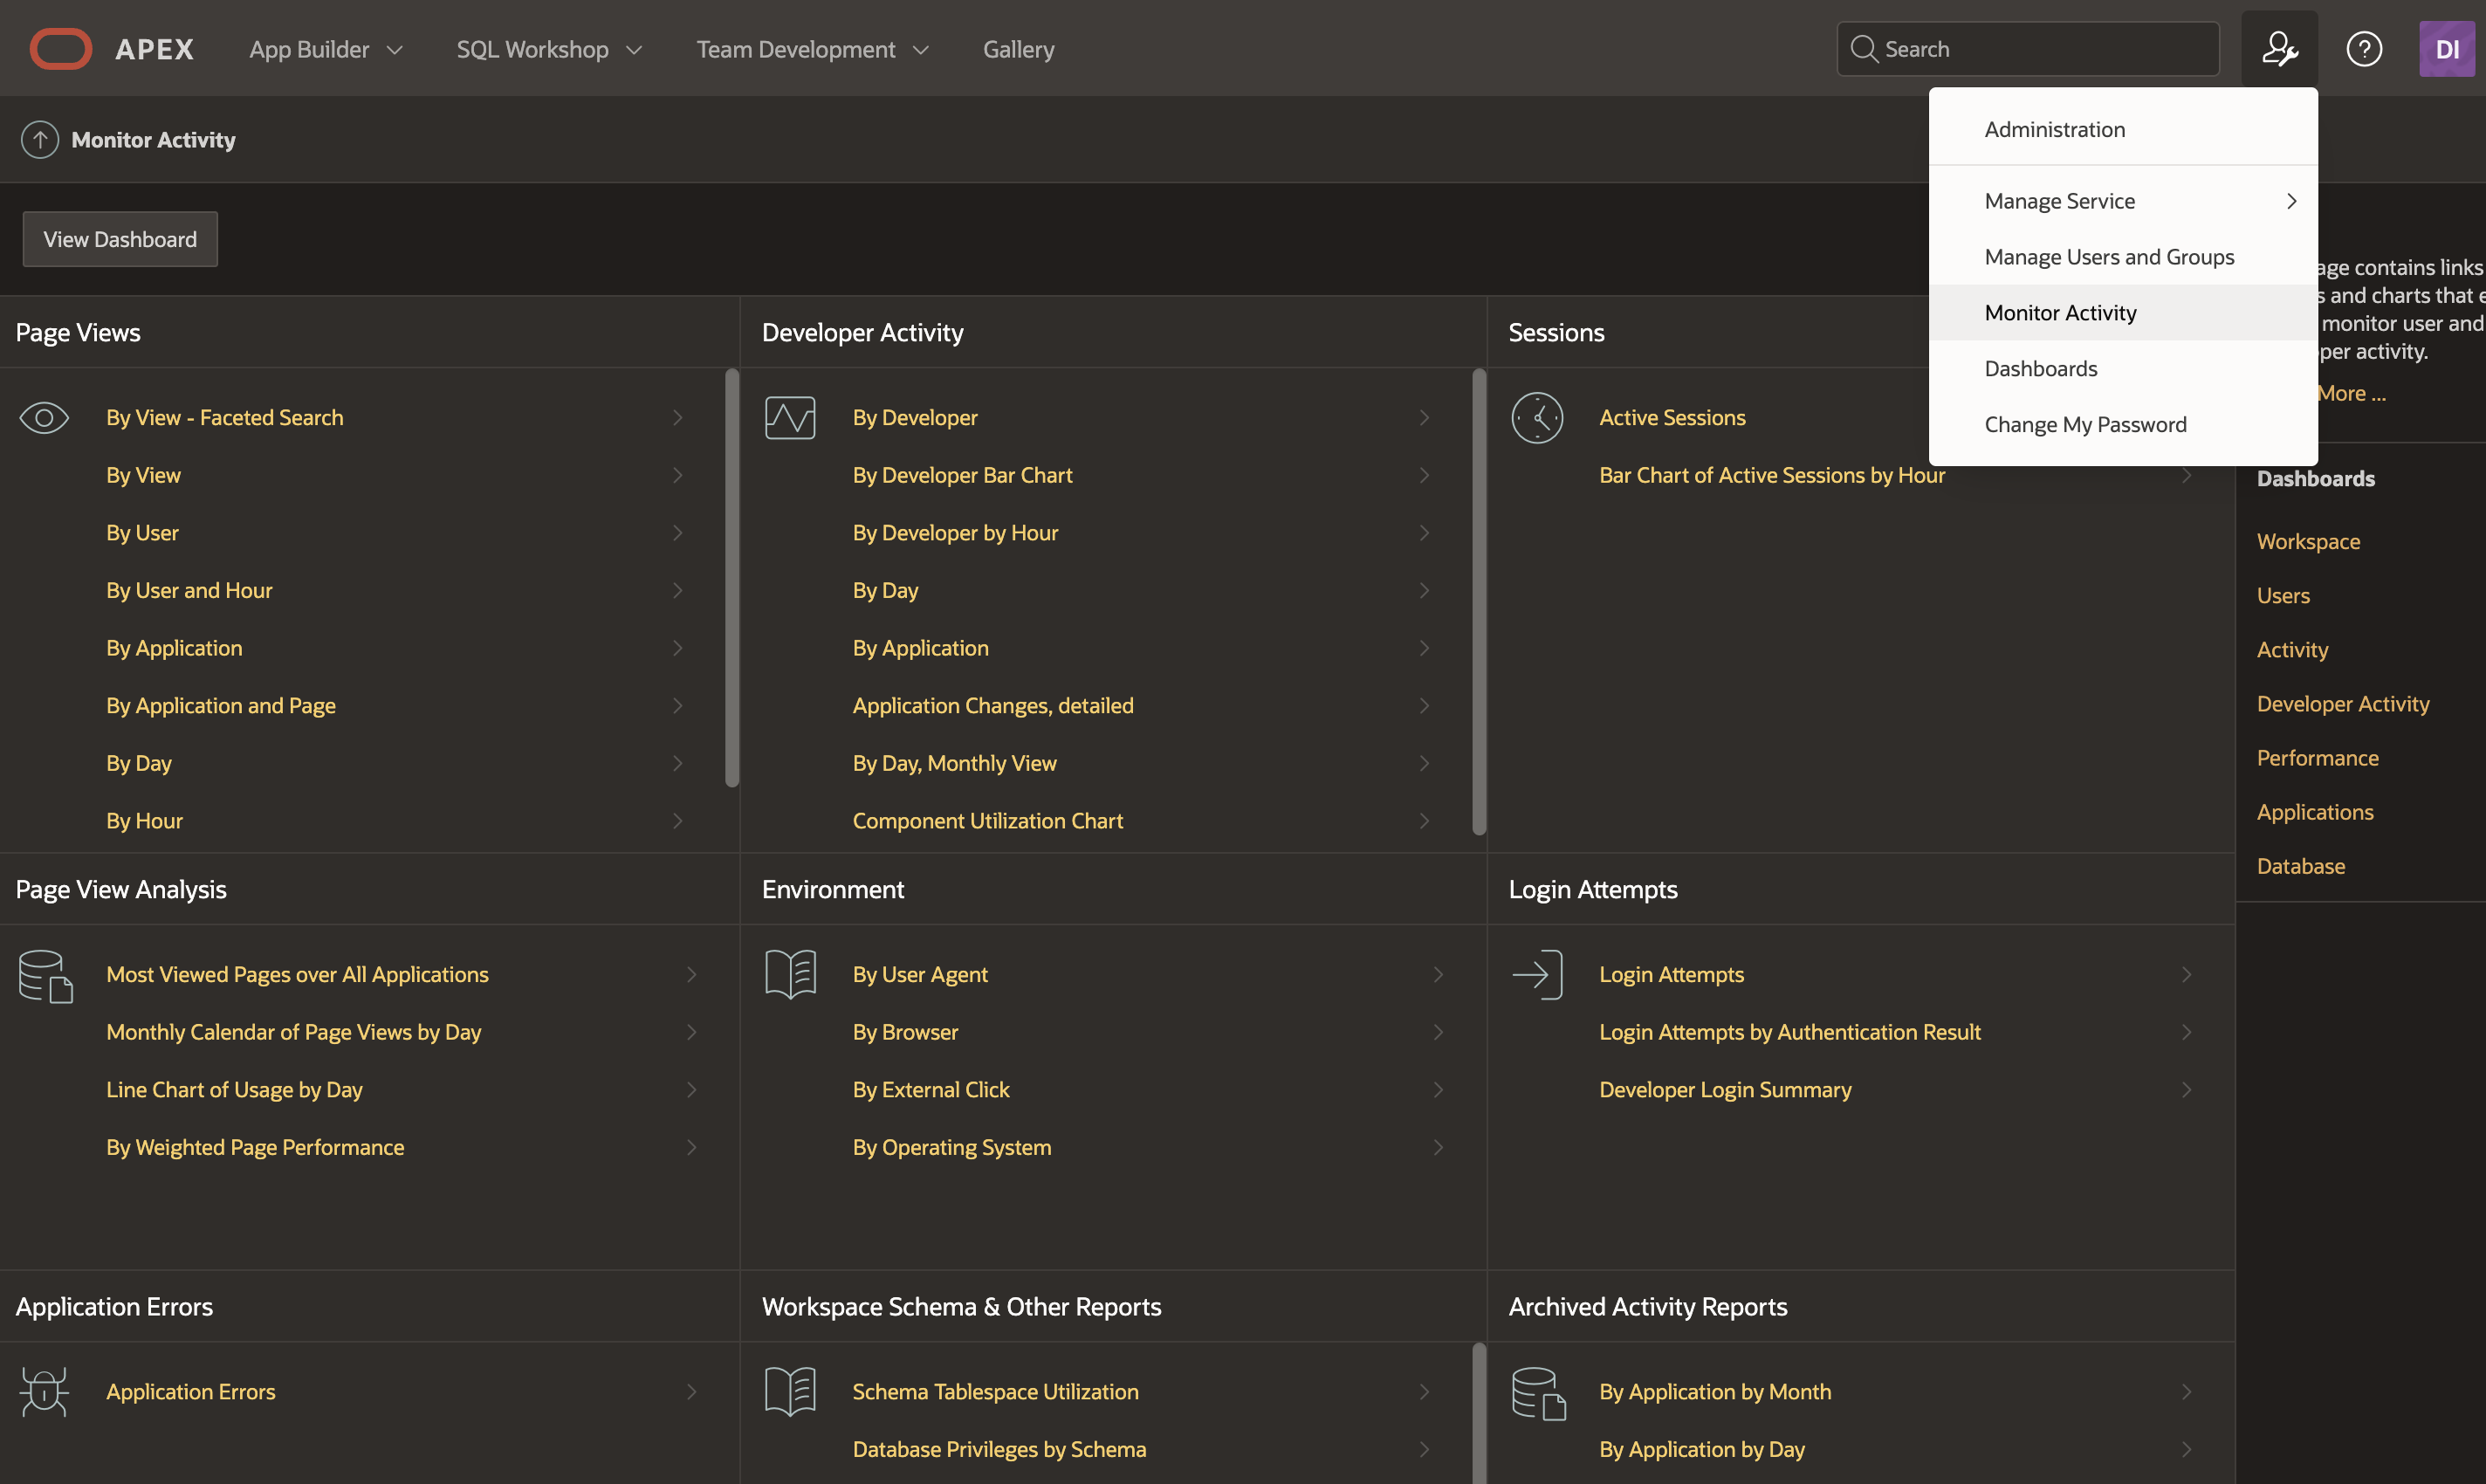
To see the logs, you either query the APEX_WORKSPACE_ACTIVITY_LOG view or you can go to the Monitor Activity section within APEX:
The proof
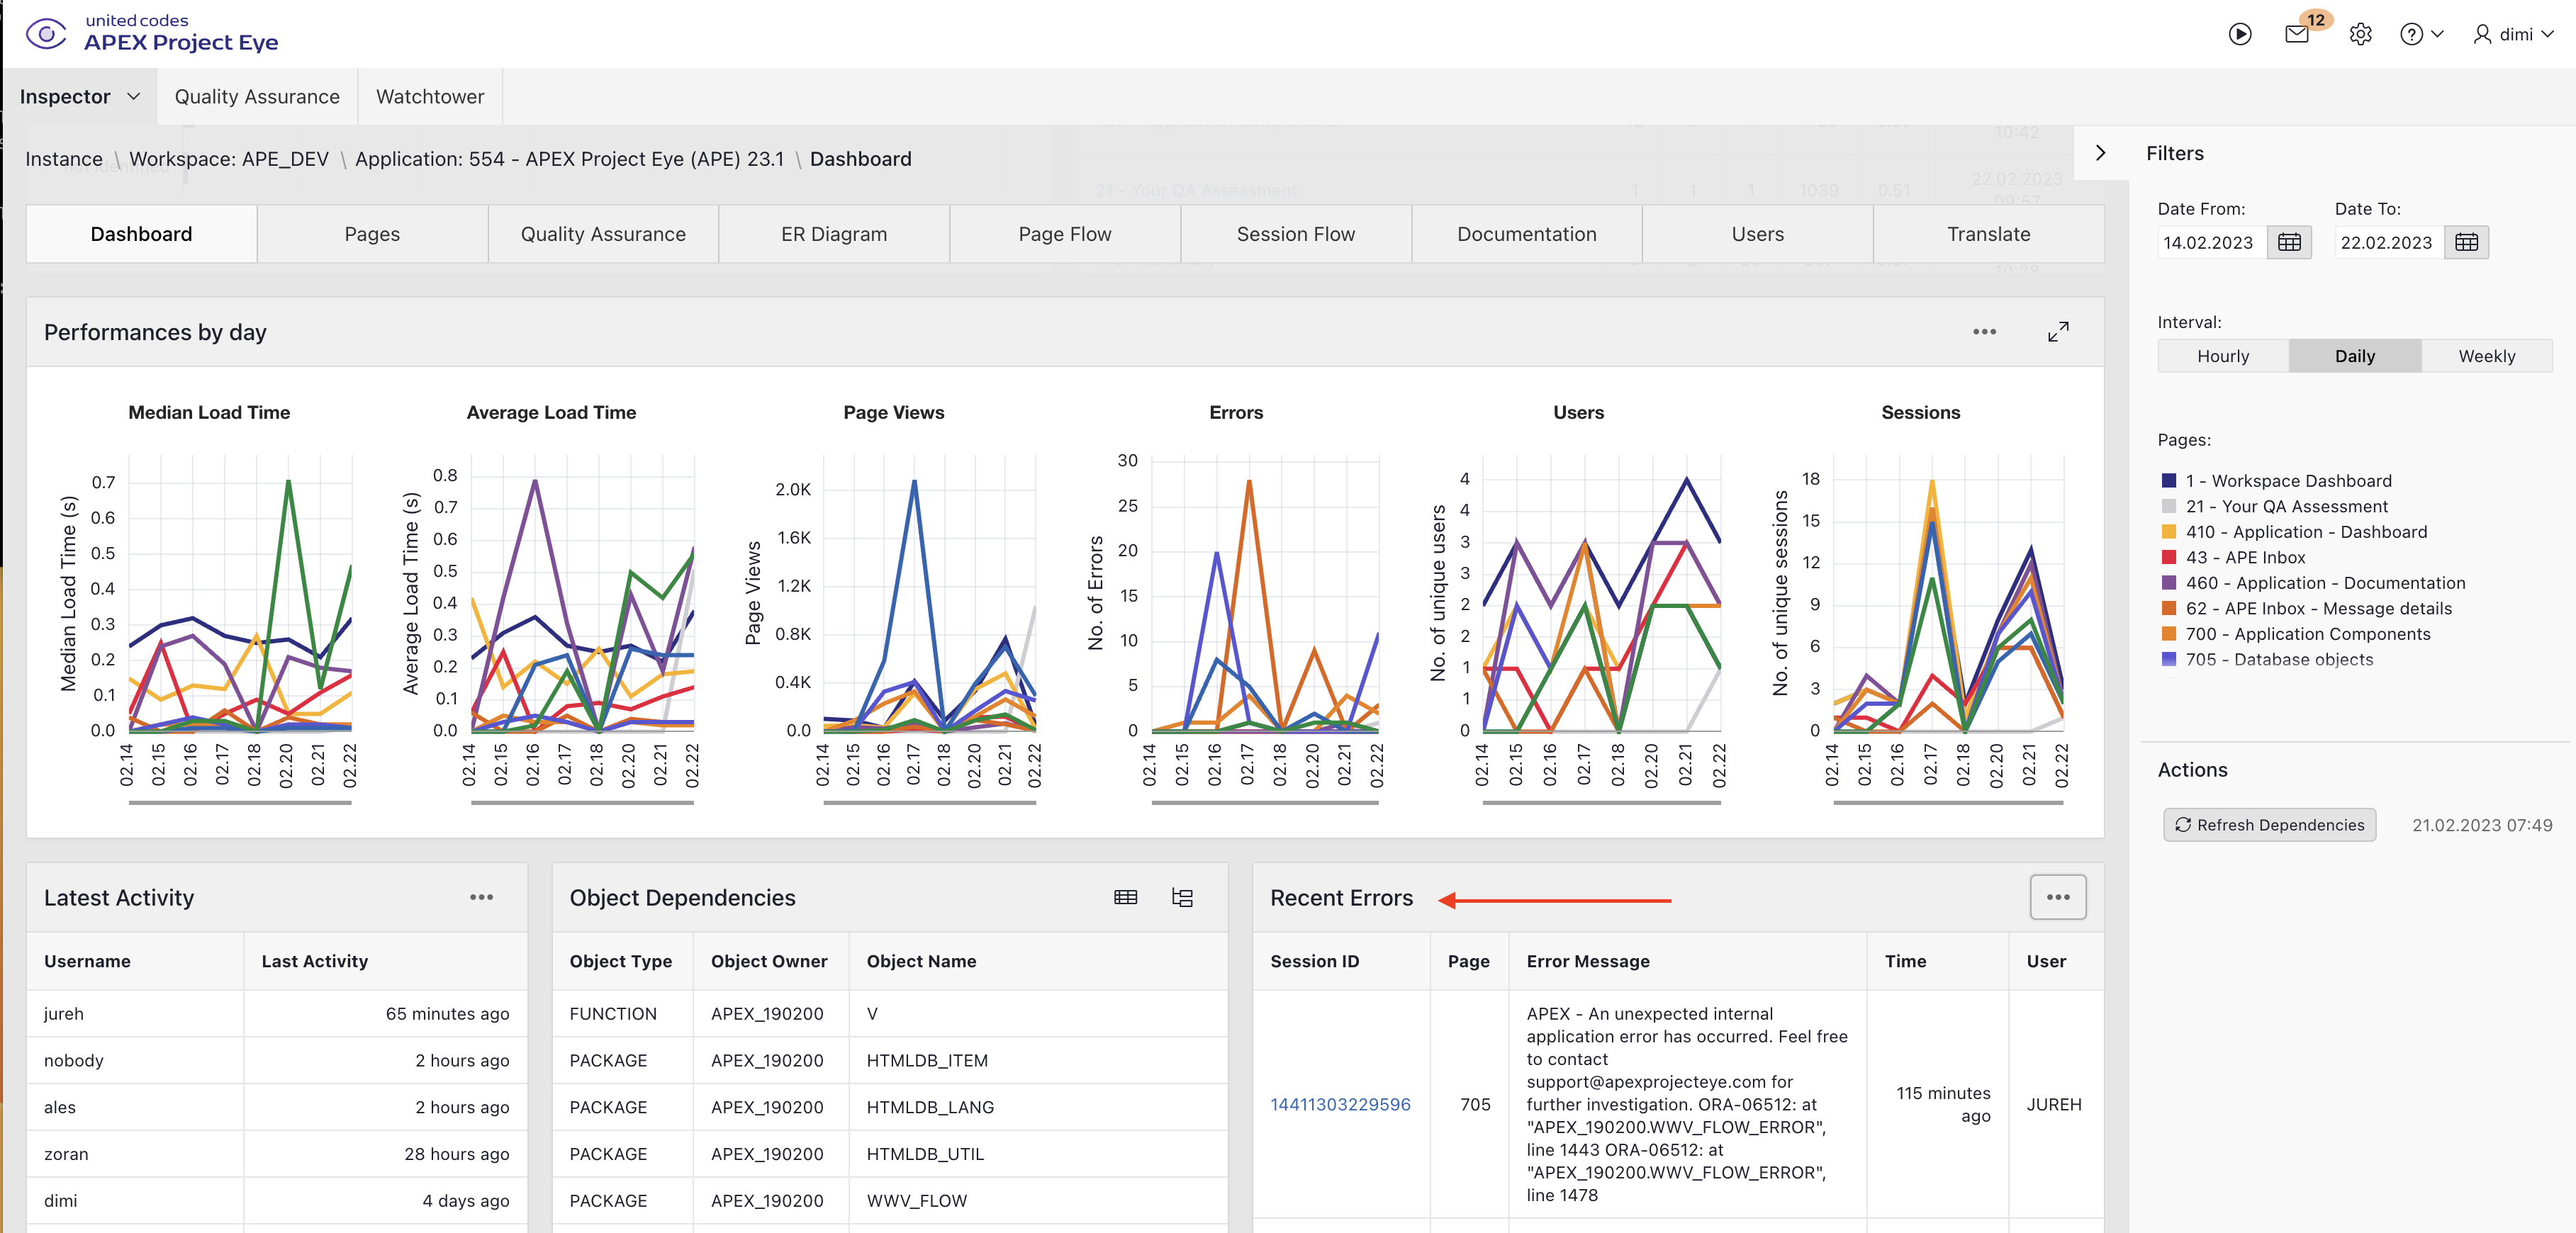
To make the activity more alive, I love to use APEX Project Eye (APE). APE is a powerhouse of tools that help any Oracle APEX developer and project manager. For me, APEX Project Eye is for Oracle APEX what Enterprise Manager is for the Oracle Database. APE is the most advanced tool to give you insight into your Oracle APEX applications, from how it was developed to how it is being used.
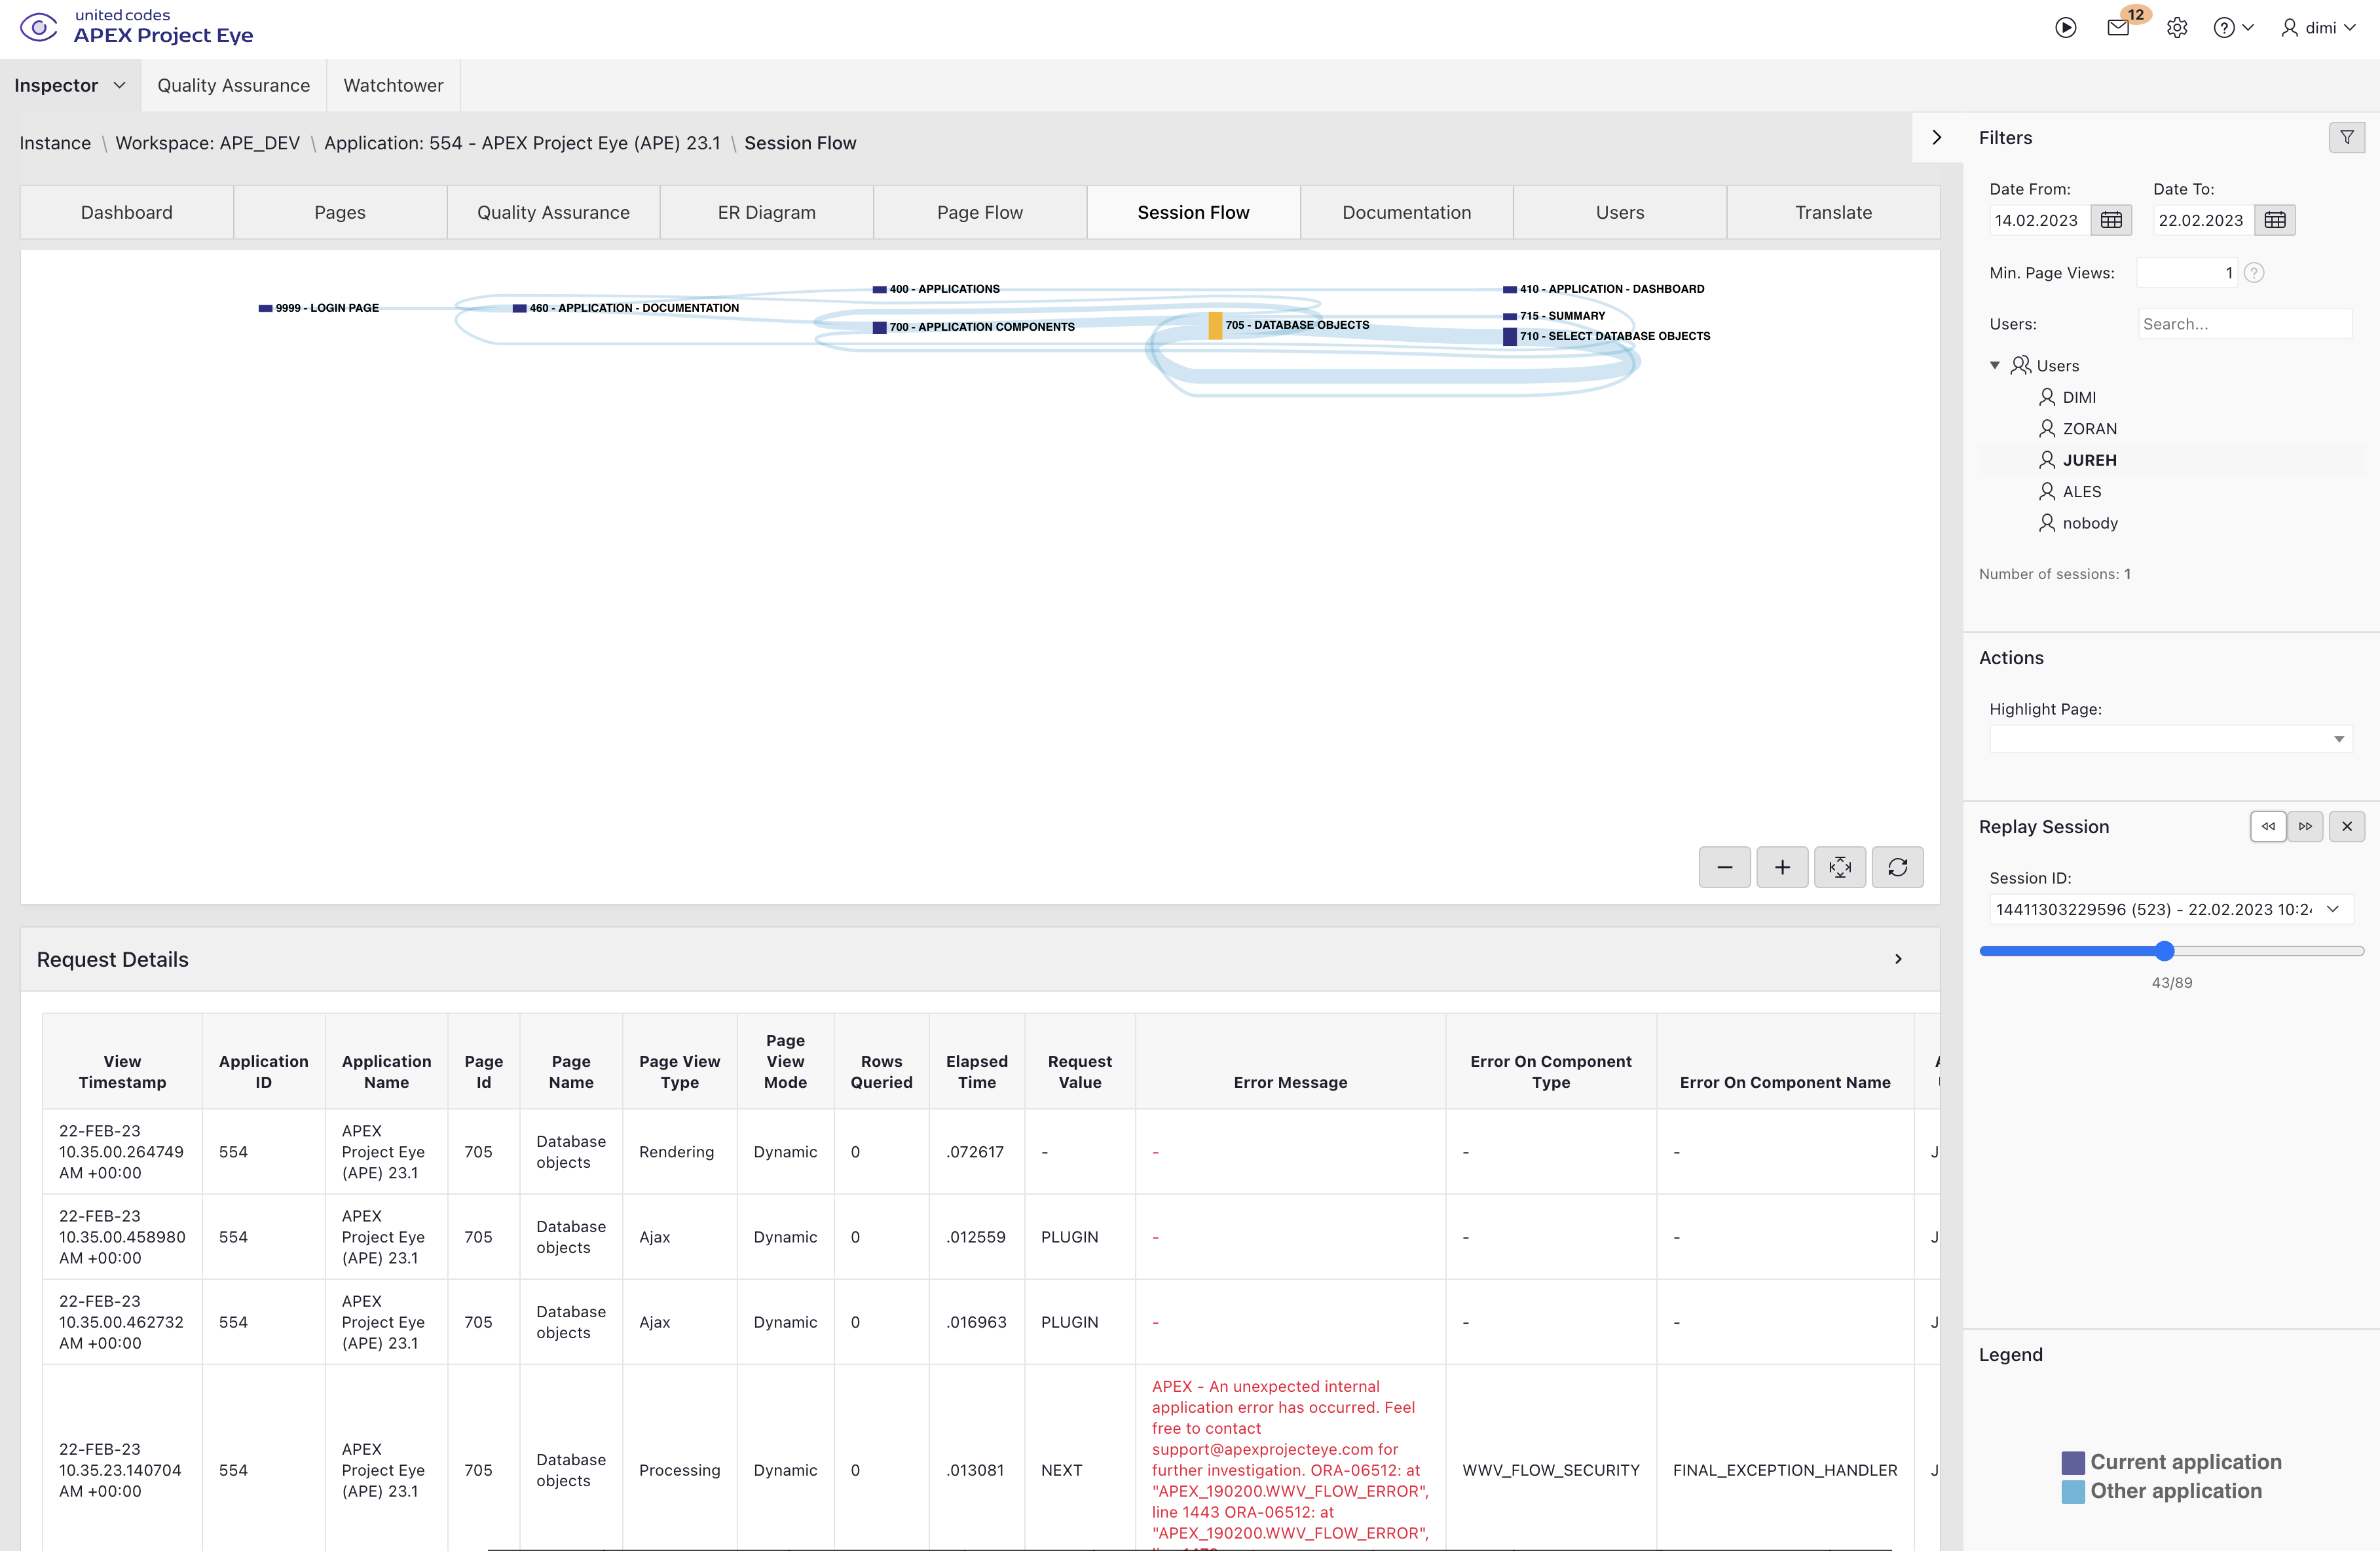
Back to our investigation on the disappearance of the records... I focused on the window from the morning when the records were there till the records disappeared. In APE, I used Session Flow to see who accessed the application during this period and accessed a page where a delete could have been done. I saw an unusually high number of going back and forth between a report and a form... In Session Flow, it shows lines between pages. The bigger the line between the pages, the more that path was taken. Session Flow also allows you to replay a session. The path gets highlighted, and you get the details of the request.
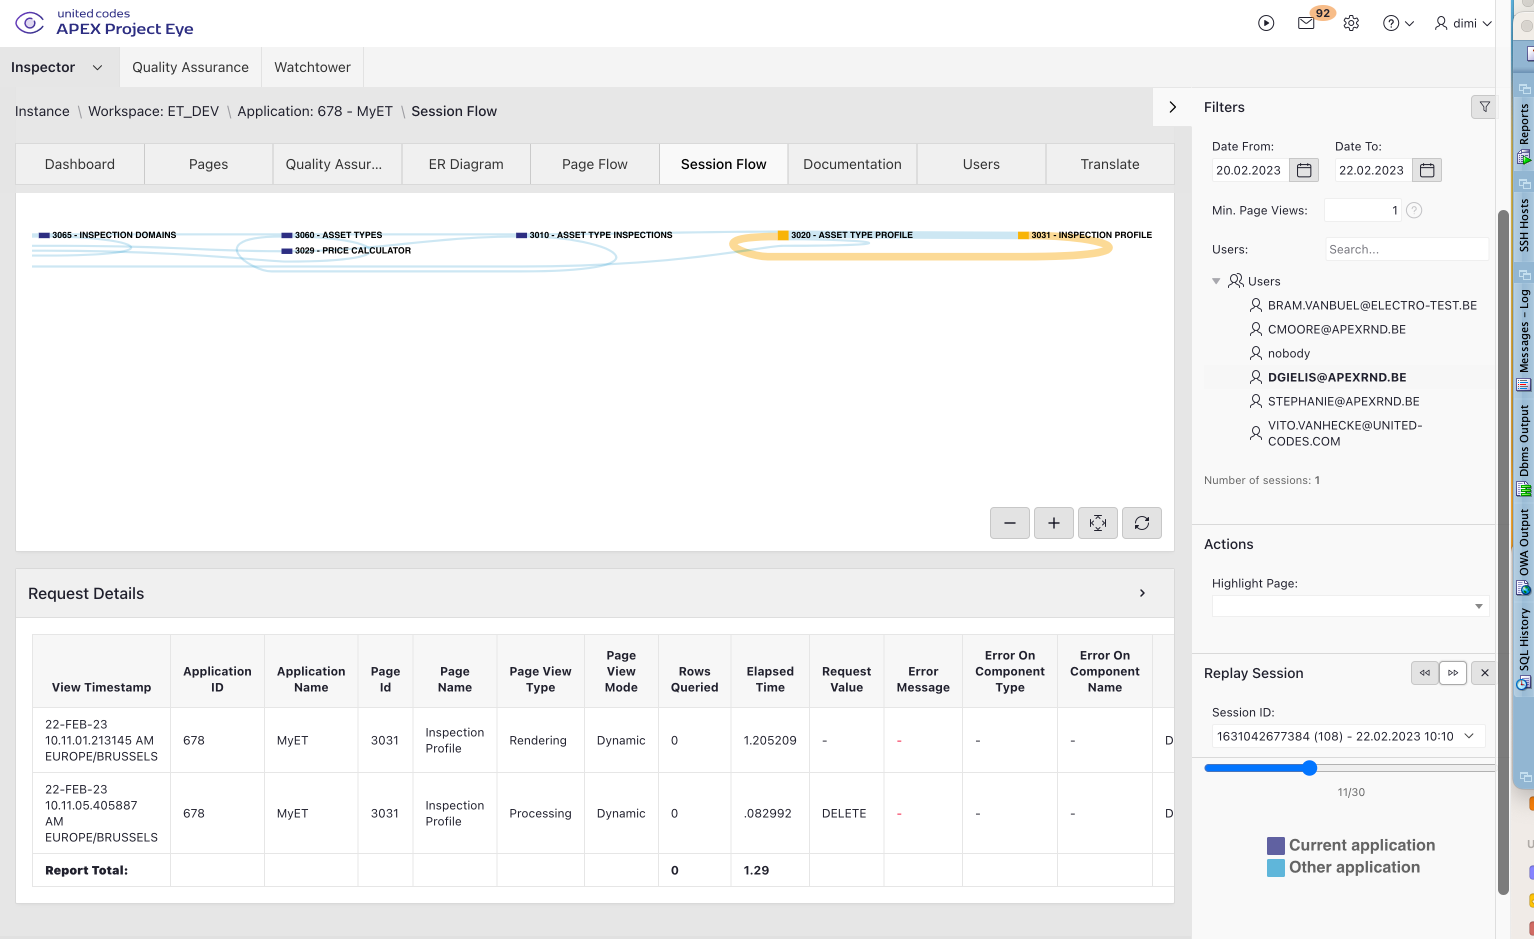
This way, I knew exactly what happened... somebody went into the records individually and deleted them. APE gave me the power to present the end-users precisely when somebody made an action visually.
APEX Project Eye helps in DEV, TEST, and PROD
We use APEX Project Eye a lot; during development (e.g., quality assurance), during testing, e.g., to review performance and error investigation, and during production to monitor our applications. Session Flow, in particular, is beneficial when APE shows an end-user got an error.
For the error, we see the Session ID, and based on this Session ID, we can replay their session until the error pops up. We know exactly what they did and don't have to ask for a reproducible case.
There was another occasion when Session Flow was a rescuer for me. At one point, we had a security breach in one of the apps. At least one person saw data in an Interactive Report that he wasn't supposed to see. He reached a page he wasn't supposed to have access to. Using Session Flow, I knew exactly how he came there, how long he had stayed on the page, and what he had done. I could, for example, see that he didn't download the data from the Interactive Report. Without Session Flow, I could have probably found out by analyzing the logs, but it would have taken me much more time. This was one of the reasons we now have Quality Assurance in APE so that APE can warn us of security risks. Do you know eSert, the popular security scanner for Oracle APEX, from a few years ago? With APE, you can use all of the eSert rules!
Recap APE's Session Flow
APE's Session Flow is fantastic for the following use cases:
See how people use the application you built.
View exactly when and how an error occurred.
Have a visual representation when you talk to project managers and end users.
Prove if an action was done or not.
To remember
Oracle APEX's built-in logging is very useful. There are settings to define the number of days the logging is kept. APEX Project Eye (APE) can help you get a better insight into these logs.